Power BI is an intelligent business tool considered a technology-driven tool in the IT sectors. The prominent reason for its growing demand is the in-built features of apps, software services, connectors, Customizable Dashboards, Power Query, Power Pivot Access and many other core features of the Power BI tool.
To have an in-depth understanding of Power BI architecture, you can join Power BI Training In Chennai, which will help you have a comprehensive understanding of how to sign up for power BI, concepts, data source, and how to create reports with visualization.
In this blog, we shall discuss what is power BI, Power BI tool, and power BI architecture in -detail.
What is Power BI
Microsoft offers the business analytics service Power BI, which enables you to share insights and display your data. It transforms data from several sources to create interactive dashboards and Business Intelligence reports.
For example, if you have sales data in an Excel sheet, Power BI assists you in creating a variety of graphs and charts to visualize the data.
Moreover, Power BI is a software service collection that combines unnecessary data sources into a readable, visual presentation and interactive insights. So, your data can be in many forms, such as Excel spreadsheets, cloud storage and on-premises hybrid data warehouses.
So, the tool analyses and visualizes the raw data into actionable insight. Now that you know what is power BI, let us examine why it is necessary.
If you want to become a Power BI Developer, you can join Power BI Training In Chennai and learn power BI desktop, query ribbon, modelling data, and how to create data visually.
Why Power BI?
When we compare other Power BI-related tools, Microsoft Power BI is the best business intelligence tool, which provides services to various business-related companies for developing their business efficiently. Due to this, many top companies utilize this tool for developing their business. Now, we shall look at why Power BI is the best business intelligence tool in the market.
- Power BI is the best tool in terms of cost, management of complexity, and efficiency.
- Power BI tool helps you access the data in various formats, including Excel, pdf, XML, JSON, CSV, etc. These data can be viewed, examined and visualized.
- Secure Data Analytics: Power BI protects the confidentiality, integrity, and availability of your company's data by offering sensitive labels, data loss prevention, and the monitoring of sensitive data using service tags, Microsoft Azure virtual network, and Azure Private Link.
- BI for everyone: Microsoft offers Power BI Desktop for free and the Power BI Pro edition for a very reasonable fee so that anybody may access the capabilities that Power BI provides at a cheap cost for expanding their business.
- Improve outcomes with market-leading AI: The most recent Microsoft AI enables non-technical people to create reports and quickly gain business insights from structured and unstructured data, including text and photos.
- Put your understanding into practice: A company may quickly create chatbots to communicate with its clients and staff using the Power BI software.
Power BI is the most demanding business intelligence tool used in every industry like data science. If you intend to become a Data Scientist, you must have a comprehensive understanding of Power BI tools. Join a Data Science Courses In Bangalore and learn the core concepts of data science.
Why is the power BI tool Important?
The following are the explanations for why the Power BI tool is so well-liked and required in the BI sectors:
Access to Volumes of Data from Multiple Source
Power BI has access to enormous amounts of data from various sources. It enables you to view, analyze, and visualize massive quantities of data that Excel cannot open.
Power BI supports several significant data sources, including Excel, Comma Separated Values, Extensible Markup Language, JavaScript Object Notation, Portable Document Format, etc. Power BI imports and caches data from the.PBIX file using robust compression methods.
Interactive User interface (UI) and user experience (UX) Features
Many business-related companies utilize the power BI tool to visualize the data appealingly. It offers simple drag-and-drop capabilities and features that let you duplicate all formatting between related visualizations.
Exceptional Excel Integration
The power BI tool helps collect, examine, publish and share Excel business data. Excel queries, statistical models, and reports may be easily connected to Power BI Dashboards by anyone familiar with Office 365.
Azure can help you prepare big data more quickly.
Substantial volumes of data may be analyzed and shared by combining Power BI with Azure. The amount of time it takes to gain insights can be decreased, and business analysts, data engineers, and data scientists can collaborate more effectively due to an Azure data lake.
Put Ideas Into Practice
You can create data-driven business decisions by using Power BI to extract insights from data and translate those insights into actions.
Real-time Stream Analytics
With the aid of the Power BI tool, you can perform real-time analysis. It enables you to access real-time analytics and data from various sensors and social media sources, ensuring you are always prepared to make business decisions.
Now you would have understood what is Power BI? And uses of the power BI tool, next we shall discuss the power BI architecture.
If you are interested in learning top business intelligence tools, you can choose Microsoft Power BI tools. So, join Power BI Online Course, which will help you understand reports and dashboard, how to create reports and dashboard and building blocks of power BI.
Power BI Architecture

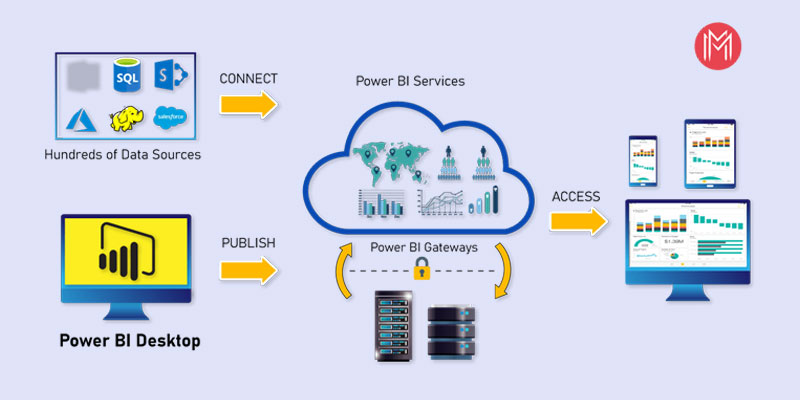
Power BI architecture is based on Azure. Power BI can connect to a wide range of data sources. You can generate reports and data visualizations on the dataset using Power BI Desktop. Power BI has a wide range of data sources to which it can connect. You may make reports and data visualizations on the dataset using Power BI Desktop.
Power BI gateway is connected to on-premise data sources to access continuous data for reporting and analytics. Cloud-based Power BI services are used to produce Power BI insights and data visualizations.
Power BI Service
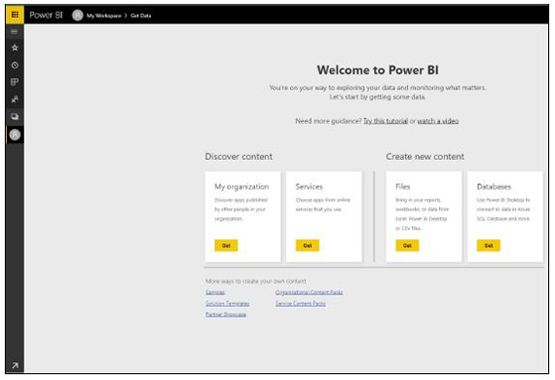
The Software as a Service (SaaS) component of Power BI is called Power BI service. It also goes by the name Power BI Online. You must log into the Power BI service to access the service.
Once you log in, here is what the Power BI Service home page looks like:

Using this tool, you can connect to the data, build dashboards and reports, and query the data.
If you want to learn about Microsoft Azure, you can join Azure Course in Chennai, which will help you have an in-depth understanding of Microsoft Windows Azure Fundamentals, Services and Microsoft Azure Solutions.
I hope you better understand what Power BI is, the uses of the power BI tool, power BI architecture, and power BI azure. Now we shall discuss Power BI Dashboard in detail.
Working on Power BI Architecture
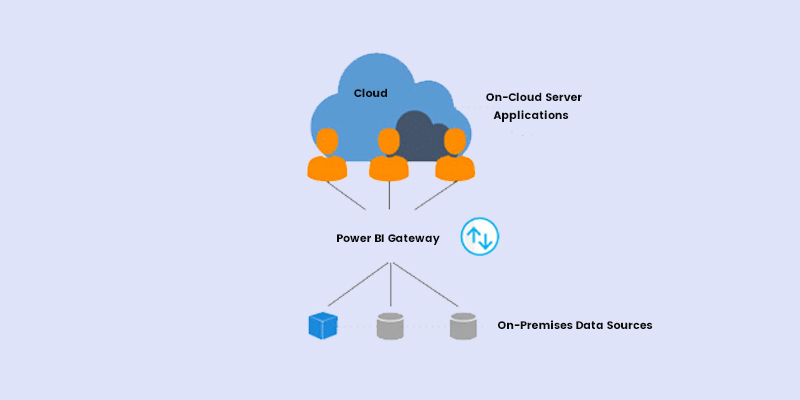
The architecture is primarily split into two sections: on-premises services and on-cloud services. From the image, it will be more obvious. It is also a Power BI data flow diagram that clarifies how data moves from on-premises to on-cloud server apps.

On-premises
Users can access any reports available on the Power BI Report Server immediately. With the help of Power Publisher, users can publish Excel workbooks to Power BI Report Server. You can make datasets, paginated reports, mobile reports, and more using the tools provided by the Report Server and Publisher.
On-cloud
Data is sent from on-premises data sources to on-cloud servers or apps using the BI gateway as a bridge in the Power BI Gateway architecture. Numerous components make up the cloud, such as dashboards, datasets, reports, Power BI Embedded, etc. Several on-cloud data sources are combined using Power BI tools.
Power BI Architecture Service
The next step is for you to comprehend the service architecture. It is based on two clusters. Let us talk about them in detail now:
The Front-end Cluster
In the Power BI data flow diagram, the front-end cluster bridges the consumer and the on-cloud servers. The consumer can communicate with the dataset spread out worldwide after the initial connection and verification using Azure Active Directory.


